Overview
This functionality aims at providing the application user to see number of batch instances in different status.
Characteristics
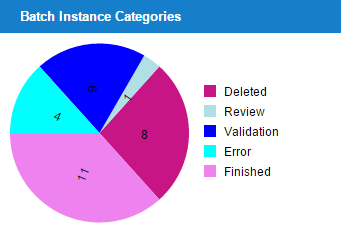
- The functionality allows one to visualize the number of batch instances in different status in form of pie chart.
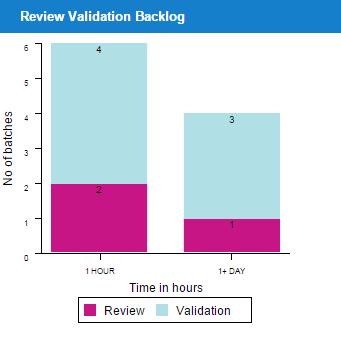
- This functionality allows one to visualize the number of batch instances in review and validate differentiated by time in form of stack chart.
Working
-
-
- When a BIM screen is loaded, then on left side of screen a pie chart showing number of batch instances based on the filter is displayed. Pie chart shows the number distribution of the batch instances incurred in various status depending on filters.
-
-
-
- A stacked chart is displayed below pie chart.
-
Stacked chart shows the number of batch instances in READY FOR REVIEW and READY FOR VALIDATION status during the following four time periods.
Period one (0-1 hour)
Period two (1-4 hour)
Period three (4hour – 1 day)
Period four (1 day+)